Input, processing and output
One key step in converting a problem into code is to identify the inputs, processes and outputs involved.
Inputs are the bits of data that need to be input to solve the
problem.
Processes are the steps that need to be taken to convert the input into output.
Output is the result of processing the inputs.
Below you can see an example that
shows the inputs processes and outputs for a program that helps you understand percentage discounts.

Structure diagrams
A structure diagram is a basic diagram that shows the way a program is broken down into subprograms and sometimes how they themselves are further divided up.

Pseudocode
Pseudocode is a language independent way to define a problem. It has its own syntax so it looks very similar to code, but small syntax errors are unlikely to impact
understanding. The syntax for your course, known as OCR refernce language, can be found on pg25-31 of the
OCR specification

| Advantages of pseudocode |
Disadvantages of pseudocode |
| It is easily converted into code in a programmer's chosen language |
It's time consuming to create |
| It's easy to understand because it has a consistent appearance and it makes programming structures clearly visible |
In larger programs it can be hard to see the way the program flows |
| Small errors are unlikely to cause problems as it is not actually code so as long as the programmer understands what is meant it will be fine |
|
Flowcharts
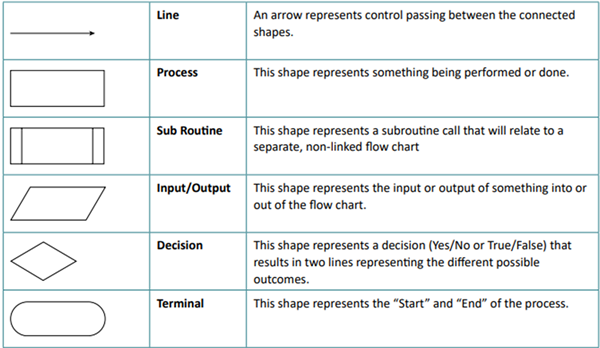
Flowcharts are a diagrammatic way to represent an algorithm. We use special symbols to represent algorithms in flowcharts.

This flowchart below shows the process for determining how much discount a customer is entitled to. The user inputs the price, if it is over
100 then the discount is set as 20% If not, we check if the price is over 50 and if so, set discount to 10% If not, we set discount to 5% Regardless of what discount was set to the
next step is to output the discount to the user

| Advantages of flowcharts |
Disadvantages of flowcharts |
| It's easy to see the flow of the program |
Large programs can span many pages making them hard to visualise |
| It uses standardised symbols that are universally understood |
Changes to the design are difficult to implement as the existing diagram needs to be respaced |