Price as a reflection of worth
Price and worth can seem like synonyms but where price is defined, it is the amount you pay for a product, worth is more subjective and different people will have different opinions on how much a product is worth. Worth can
also vary while the price remains the same. A cold drink available at your tennis club for £1 might seem more worth it after you have played and are hot and sweaty. Sentimentality and personal opinion will also impact worth.
Sometimes consumers will pay a higher price for a product but still feel it is worth it. Many brands count on it.
The determination of price and the allocation of resources
Prices help to allocate resources in a market economy. Consumers send signals through their preferences to producers of what things they want them to produce. This is also known as consumer sovereignty. Producers will move
their resources to wherever they can get the best return. This means unsuccessful industries decline and popular ones grow.
Prices can also have a rationing effect on goods with limited supply. As they become more limited in supply the price will increase and as this happens less people will be able to afford them and demand will go down.
The factors that collectively affect supply and demand are known as market forces. These largely determine price in a market economy but government intervention may also impact the price in some markets.
Exam style questions
Use the space below each question or a pen and paper to write your answer. When complete click the button for the answer and mark scheme.
NOTE: Answers typed into the browser will not be retained if you leave the page or refresh
Questions
Explain the difference between price and worth. (2 marks)
Price is the amount you have to pay for something(1) where as worth is more subjective as what something is worth will vary from one person to the next.(1)
Explain what is meant by equilibrium price and quantity. (2 marks)
Individual demand is the amount of a good or service that an individual would buy at each price in a given time period(1)
Market demand is the total demand from all potential customers at each price in a given time period.(1)
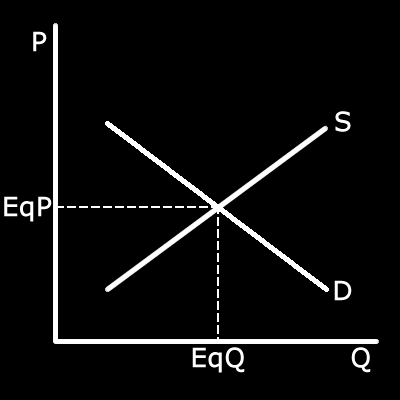
Draw an market equilibrium curve. (2 marks)

You don't have to draw the dotted lines but you need to make sure you labelled the x and y axis and the demand and supply curves.
1 mark for the line at the supply and demand sloping in the right directions, 1 mark for all the labels.
Explain what consumer soverignty is. (2 marks)
The way that consumers through their decisions(1) influence what is produced.(1)
Case study/Scenario
Steve runs a driving school called Oldhill Driving School. Both his major competitors raise the price they charge for their lessons but Steve does not.
Analyse the effect on Oldhill Driving School. (6 marks)
Sample answer:
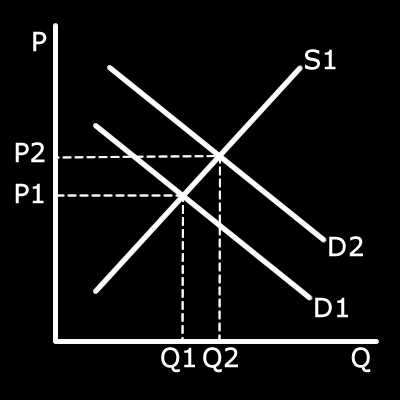
 Right shift of demand
Diagram can substitute for the first two points - A rise in price for a
substitute good like his competitors lessons{A01} means an increase in demand for his lessons{AO2} because some of the people who would have taken lessons with his competitors may now come to him instead{AO3a} meaning an increase
in profits.{AO3a}
He can then use those profits to invest back into the business perhaps with additional marketing{AO2} which could further improve demand in the future.{AO3a}
Case study/Scenario
The Jones Food Company is building the worlds largest vertical farm in Gloucestershire. This is an indoor climate controlled method of farming that uses hydroponics to reduce water usage by 95% and can be feulled by 100% renewable
energy. In addition, because the plants are grown inside there is no risk of fertilizer run off polluting rivers in the area. Because of its efficient methods it can greatly reduce costs in the production of edible plants that could
not otherwise be produced in the UK meaning lower transport costs and less food miles.
Analyse the effect on the Jones Food Company of successfully implementing vertical farming. (6 marks) NOTE: This story is about a real farm. Pretty interesting stuff. Look it up after you finish the question.
Sample answer:
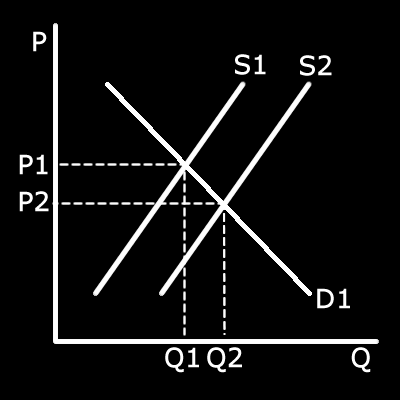
 Right shift of supply
Graph can substitute for first two points - An ability to produce more with fewer resources{AO2} means
they can supply more at each price.{AO1} This means they can lower their prices and attract more customers{AO3a} leading to more revenue and more profit.{AO3a}
This profit can then be reinvested back into the business to
further develop their technoology or increase the scale of their production{AO2} which will lead to further profit in the future.{AO3a}